How did I make them? Originally it was all ad-hoc ActionScript code, but more recently I've begun to organize the code into a library and translate it into TypeScript (which, in turn, is automatically translated into JavaScript). Although this library is still in progress, I've decided it's at a stage where I can open it to the general public.
This library includes functionality for:
- Modeling scientific concepts such as taxa, phylogeny, character states, stratigraphy, and geography.
- Processing scientific data (notably calculating morphological distance and inferring unknown character states).
- Rendering data into charts as Scalable Vector Graphics, using RaphaëlJS.
For a while I struggled with what to call this library. It's neither purely about science nor purely about graphics. Finally I got my inspiration from RaphaëlJS, a graphics library named after a great artist. I named my library after a man who was both a great artist and a great biologist:
 |
| Ernst Heinrich Philipp August von Haeckel |
Who better than Ernst Haeckel? Not only was he the author/illustrator of Kunstformen der Natur (Art Forms of Nature), but he was also an import figure in the history of biology, coining such words as ecology and phylogeny. (Who knows what we'd be calling them otherwise?)
 |
| An illustration by Ernst Haeckel of various protists. (Oh, he also coined Protista.) |
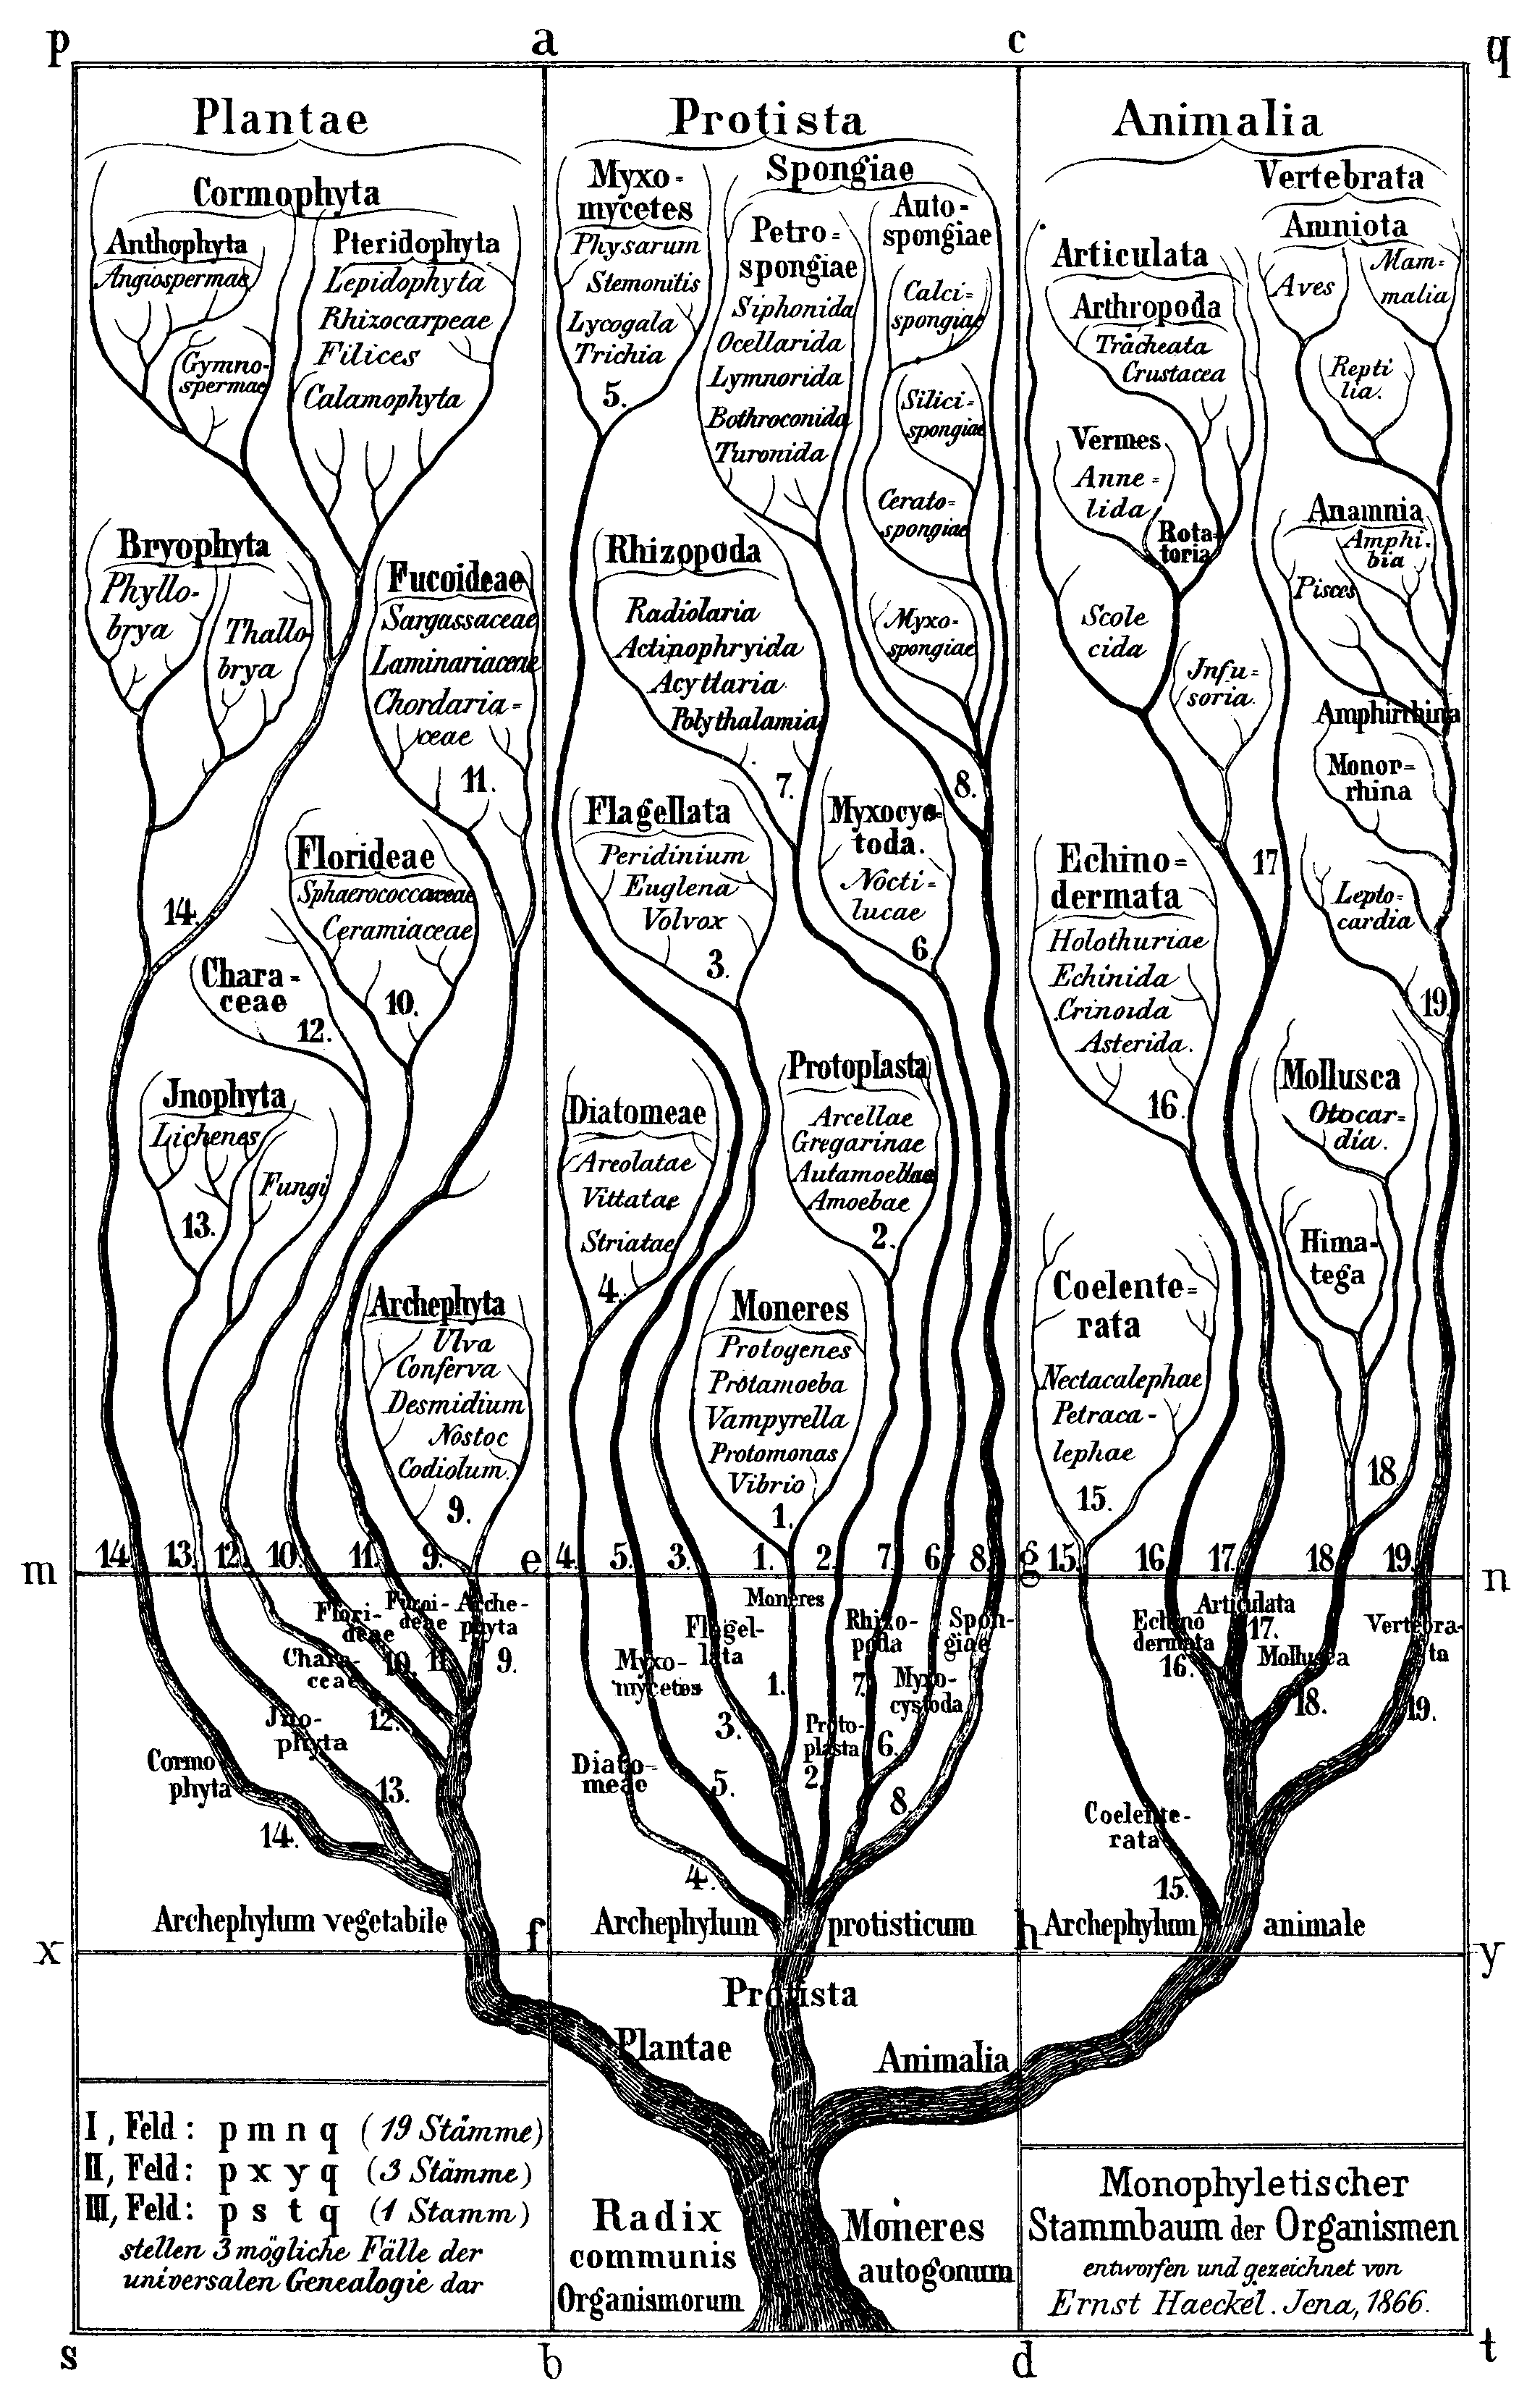 |
| Possibly the earliest illustrated phylogeny, showing posited relationships of all eukaryotes. |
So, I present my TypeScript/JavaScript library, Haeckel. The source can be downloaded on the Haeckel BitBucket page, either archived or checked out using Mercurial.
Some notes:
- It is not thoroughly tested. I would be shocked if there weren't any remaining bugs.
- There is no documentation. I probably won't have time for this for a while. The TypeScript is mostly pretty readable, though. Kinda.
- The TypeScript compiler is required to make changes or additions to the code. However, the JavaScript files (bin/Haeckel.js, bin/Haeckel.min.js) can be used as is.
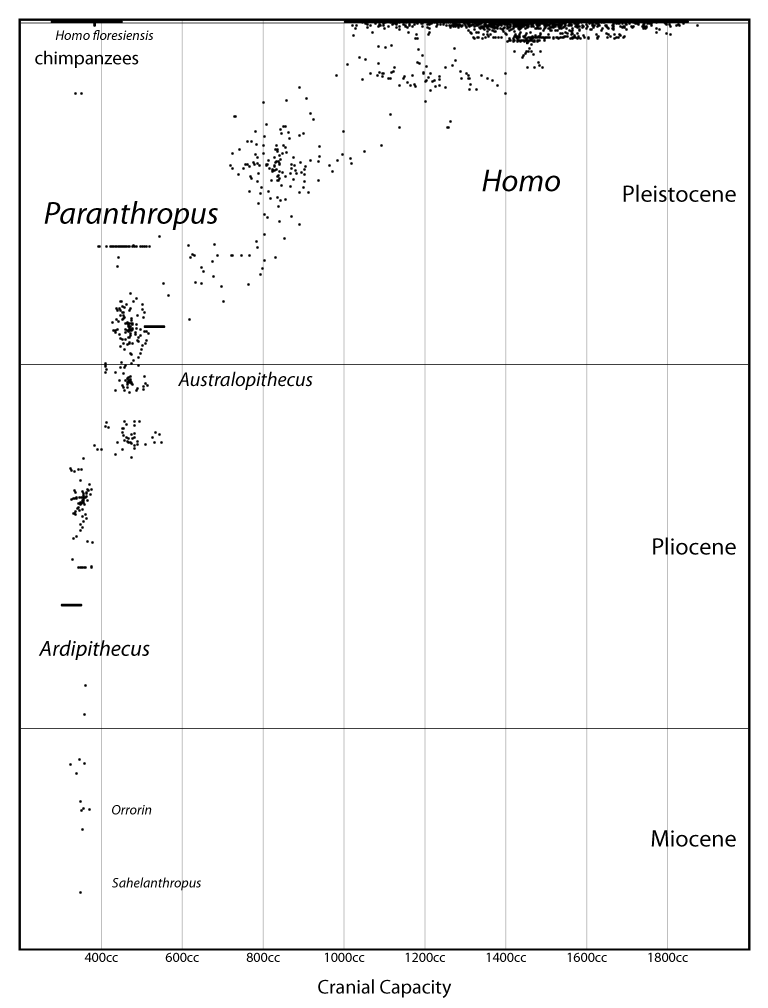
- Only the OccurrencePlotChart (see example above) is really complete. Other chart types should be rolling out soon, though.
- It requires a browser that implements ECMAScript 5. (In other words, not Internet Explorer.) I decided to rely on this because I don't see people using it on websites, but rather to create graphics that can then be exported as SVG files. (And then uploaded elsewhere, edited in Illustrator, converted to raster images, whatever.)
Speaking of which, I need to add the code that exports files.(Done.)
Enjoy! Or, more likely, wait until it's more mature and then enjoy!
No comments:
Post a Comment